Market Outlook
March 01, 2017
Market Cues
Domestic Indices
Chg (%)
(Pts)
(Close)
Indian markets are likely to open flat with positive bias tracking the SGX Nifty.
BSE Sensex
(0.2)
(70)
28,743
US stocks moved lower during Tuesday’s session as mixed economic data came in.
Nifty
(0.2)
(17)
8,880
GDP growth data came in at 1.9 percent against an expectation of 2.1 percent. The
Mid Cap
0.1
18
13,552
Conference Board stated that its consumer confidence index had climbed to 114.8
Small Cap
0.6
81
13,691
in February against an expectation of 110.9. Telecom stocks were weak with the
NYSE Arca North American Telecom Index falling 1.7 percent.
Bankex
(0.0)
(11)
23,482
UK stocks had another flat session with the index closing slightly higher. The
homebuilding company Taylor Wimpey advanced 1.12 percent. The homebuilder
Global Indices
Chg (%)
(Pts)
(Close)
saw its 2016 EBT rise by 21 percent as it benefitted from a rising U.K. housing
Dow Jones
(0.1)
(25)
20,812
market. Miner Fresnillo initially fell by 2 percent after lowering its gold production
Nasdaq
(0.6)
(36)
5,825
targets for 2017 but finished the session unchanged.
FTSE
0.1
10
7,263
The Indian indices continued their fall on Tuesday due to concerns over the
Nikkei
0.1
12
19,119
upcoming GDP data coming out later in the day. The Capital Goods index was up
Hang Seng
(0.8)
(184)
23,741
0.67 percent due to BHEL rallying by 6 percent. The Oil and Gas index was down
Shanghai Com
0.4
13
3,242
1.34 percent as investors examined developments regarding HPCL’s expected
merger with ONGC.
Advances / Declines
BSE
NSE
News Analysis
Advances
1,449
912
CRISIL upgrades outlook on Vedanta debt to Positive
Declines
1,366
732
Detailed analysis on Pg2
Unchanged
209
80
Investor’s Ready Reckoner
Key Domestic & Global Indicators
Volumes (` Cr)
Stock Watch: Latest investment recommendations on 150+ stocks
BSE
4,988
Refer Pg5 onwards
NSE
27,101
Top Picks
Net Inflows (` Cr)
Net
Mtd
Ytd
CMP
Target
Upside
Company
Sector
Rating
(`)
(`)
(%)
FII
(145)
9,451
9,404
Amara Raja Batteries Auto & Auto Ancillary
Buy
859
1,009
17.5
MFs
(31)
(54)
5,162
HCL Tech
IT
Buy
840
1,000
19.0
Power Grid Corp.
Power
Buy
192
223
16.1
Top Gainers
Price (`)
Chg (%)
Navkar Corp.
Others
Buy
166
265
60.0
Ktkbank
138
6.8
KEI Industries
Others
Buy
179
207
15.9
More Top Picks on Pg3
Kscl
496
6.4
Rcom
39
6.0
Key Upcoming Events
Bhel
162
5.9
Previous
Consensus
Date
Region
Event Description
Reading
Expectations
Sparc
337
5.4
Mar 01 Germany PMI Manufacturing
57.0
57.0
Mar 01 Germany Unemployment change (000's)
(26.0)
(10.0)
Top Losers
Price (`)
Chg (%)
Mar 01 UK
PMI Manufacturing
55.9
55.8
Hindpetro
538
(3.9)
Mar 01 Germany PMI Services
54.4
54.4
Edelweiss
137
(3.7)
Mar 02 China
PMI Manufacturing
51.3
51.2
More Events on Pg4
Bpcl
670
(2.8)
Grasim
993
(2.5)
Coalindia
322
(2.5)
As on February 28, 2017
Market Outlook
March 01, 2017
News Analysis
CRISIL upgrades outlook on Vedanta debt to Positive
Rating agency CRISIL has revised its outlook on debt instruments of Vedanta Ltd to
"positive" from "stable" on expected improvement in operating profits in FY18.
The outlook revision reflects expected strong improvement in EBITDA in FY17. This
improvement was driven by production ramp-up of zinc, aluminium, and iron ore,
and better profitability due to operating leverage, and a continued focus on
reducing cost of production. Also, favourable commodity prices will probably lead
to better-than-expected cash flow.
Consequently, net debt to EBITDA ratio, which had increased to 4 times in FY16, is
expected to be about 3 times in FY17. This ratio may improve to around 2.5 times
in FY18 primarily due to increase in EBITDA.
Many factors are expected to contribute to enhancing financial flexibility. First,
recent refinancing of debt at Vedanta Plc, further plans to refinance debt due in
fiscals 2018 and 2019 are key factors. Plus, focus on reduction in gross debt and
access to Cairn India's cash post-merger will also contribute to financial flexibility.
Economic and Political News
Ministry of Statistics and Programme Implementation expects FY17 per capita
income rising 10% YoY to `103,818
GDP growth slows to 7% in Q3FY17
Economic Affairs Secretary emphasizes that recapitalisation for PSU banks to
be linked to performance
Spending on digital media to reach 24% of total advertising spending by 2020
Corporate News
NHPC to buy back shares worth `2,616cr
Centre pays Gujarat and Assam `22,000cr royalty to bail out ONGC and OIL
in royalty dues dispute
Reliance Jio to collaborate with networking giant Cisco to further expand Jio
existing multi-terabit capacity
Eicher Motors unconcerned by launch of Bajaj Dominar
Market Outlook
March 01, 2017
Top Picks
Large Cap
M
arket Cap
CM
P
T
arget
Upsid
e
Company
Rationale
(` Cr)
(`)
(`)
(%)
To outpace battery industry growth due to better
Amara Raja Batteries
14,664
859
1,009
17.5
technological products leading to market share gains in both
the automotive OEM and replacement segments.
The stock is trading at attractive valuations and is factoring
HCL Tech
1,18,555
840
1,000
19.0
all the bad news.
Back on the growth trend, expect a long term growth of 14%
Infosys
2,32,520
1,012
1,249
23.4
to be a US$20bn in FY2020.
Strong order backlog and improvement in execution would
Larsen & Toubro
1,37,169
1,470
1,634
11.1
trigger the growth for the L&T
One of the largest pharma companies with strong
Lupin
66,480
1,472
1,809
22.9
international presence. It has a rich pipeline of ANDAs which
is also one of the largest among the generic companies.
Going forward, we expect the company to report strong
Power Grid Corporation
1,00,447
192
223
16.1
top-line CAGR of ~16% and bottom-line CAGR of ~19%
over FY16-18 on back of strong capitalization guidance
Source: Company, Angel Research
Mid Cap
M
arket Cap
CM
P
T
arget
Upsid
e
Company
Rationale
(` Cr)
(`)
(`)
(%)
We expect the company would report strong profitability
Asian Granito
855
284
351
23.5
owing to better product mix, higher B2C sales and
amalgamation synergy.
Among the top 4 players in the consumer durables segment.
Bajaj Electricals
2,635
260
295
13.3
Improved profitability backed by turn around in E&P segment.
Strong order book lends earnings visibility.
Favourable outlook for the AC industry to augur well for
Cooling products business which is out pacing the market
Blue Star
5,399
565
634
12.2
growth. EMPPAC division's profitability to improve once
operating environment turns around.
With a focus on the low and medium income (LMI) consumer
Dewan Housing Finance
10,432
333
350
5.1
segment, the company has increased its presence in tier-II &
III cities where the growth opportunity is immense.
Strong loan growth backed by diversified loan portfolio and
Equitas Holdings
5,981
177
235
32.6
adequate CAR. ROE & ROA likely to remain decent as risk of
dilution remains low. Attractive valuations considering growth.
Economic recovery to have favourable impact on advertising
& circulation revenue growth. Further, the acquisition of a
Jagran Prakashan
6,099
187
225
20.6
radio business (Radio City) would also boost the company's
revenue growth.
High order book execution in EPC segment, rising B2C sales
KEI Industries
1,389
179
207
15.9
and higher exports to boost the revenues and profitability
Speedier execution and speedier sales, strong revenue visibilty
Mahindra Lifespace
1,415
345
522
51.5
in short-to-long run, attractive valuations
Higher growth in domestic branded sales and healthy export
Mirza International
1,110
92
107
16.0
to boost the profitability.
Massive capacity expansion along with rail advantage at ICD
Navkar Corporation
2,362
166
265
60.0
as well CFS augurs well for the company
Market leadership in Hindi news genre and no. 2 viewership
ranking in English news genre, exit from the radio business,
TV Today Network
1,551
260
385
48.1
and anticipated growth in ad spends by corporates to benefit
the stock.
Source: Company, Angel Research
Market Outlook
March 01, 2017
Key Upcoming Events
Global economic events release calendar
Bloomberg Data
Date
Time
Country
Event Description
Unit
Period
Last Reported
Estimated
Mar 01, 2017
7:00 PM US
GDP Qoq (Annualised)
% Change
4Q S
1.90
2.10
2:25 PM Germany Unemployment change (000's)
Thousands
Feb
-26.00
-10.00
7:00 PM US
Initial Jobless claims
Thousands
Feb 25
244.00
245.00
3:00 PM UK
PMI Manufacturing
Value
Feb
55.90
55.80
Mar 02, 2017
6:30 AM China
PMI Manufacturing
Value
Feb
51.30
51.20
Mar 03, 2017
2:25 PM Germany PMI Services
Value
Feb F
54.40
54.40
Mar 07, 2017
3:30 PM Euro Zone Euro-Zone GDP s.a. (QoQ)
% Change
4Q F
0.40
Mar 08, 2017
China
Exports YoY%
% Change
Feb
7.90
Mar 09, 2017
7:00 AM China
Consumer Price Index (YoY)
% Change
Feb
2.50
6:15 PM Euro Zone ECB announces interest rates
%
Mar 9
0.00
Mar 10, 2017
India
Imports YoY%
% Change
Feb
10.70
India
Exports YoY%
% Change
Feb
4.30
3:00 PM UK
Industrial Production (YoY)
% Change
Jan
4.30
5:30 PM India
Industrial Production YoY
% Change
Jan
-0.40
7:00 PM US
Unnemployment rate
%
Feb
4.80
4.70
7:00 PM US
Change in Nonfarm payrolls
Thousands
Feb
227.00
175.00
Mar 14, 2017 12:00 PM India
Monthly Wholesale Prices YoY%
% Change
Feb
5.25
US
Producer Price Index (mom)
% Change
Feb
1.10
Mar 15, 2017
3:00 PM UK
Jobless claims change
% Change
Feb
(42.40)
6:00 PM US
Consumer price index (mom)
% Change
Feb
0.60
0.00
Mar
11:30 PM US
FOMC rate decision
0.75
0.75
%
15
Mar 16, 2017
3:30 PM Euro Zone Euro-Zone CPI (YoY)
%
Feb F
1.80
6:00 PM US
Housing Starts
Thousands
Feb
######
1250.00
6:00 PM US
Building permits
Thousands
Feb
######
1250.00
6:45 PM US
Industrial Production
%
Feb
(0.25)
0.40
Source: Bloomberg, Angel Research
Market Outlook
March 01, 2017
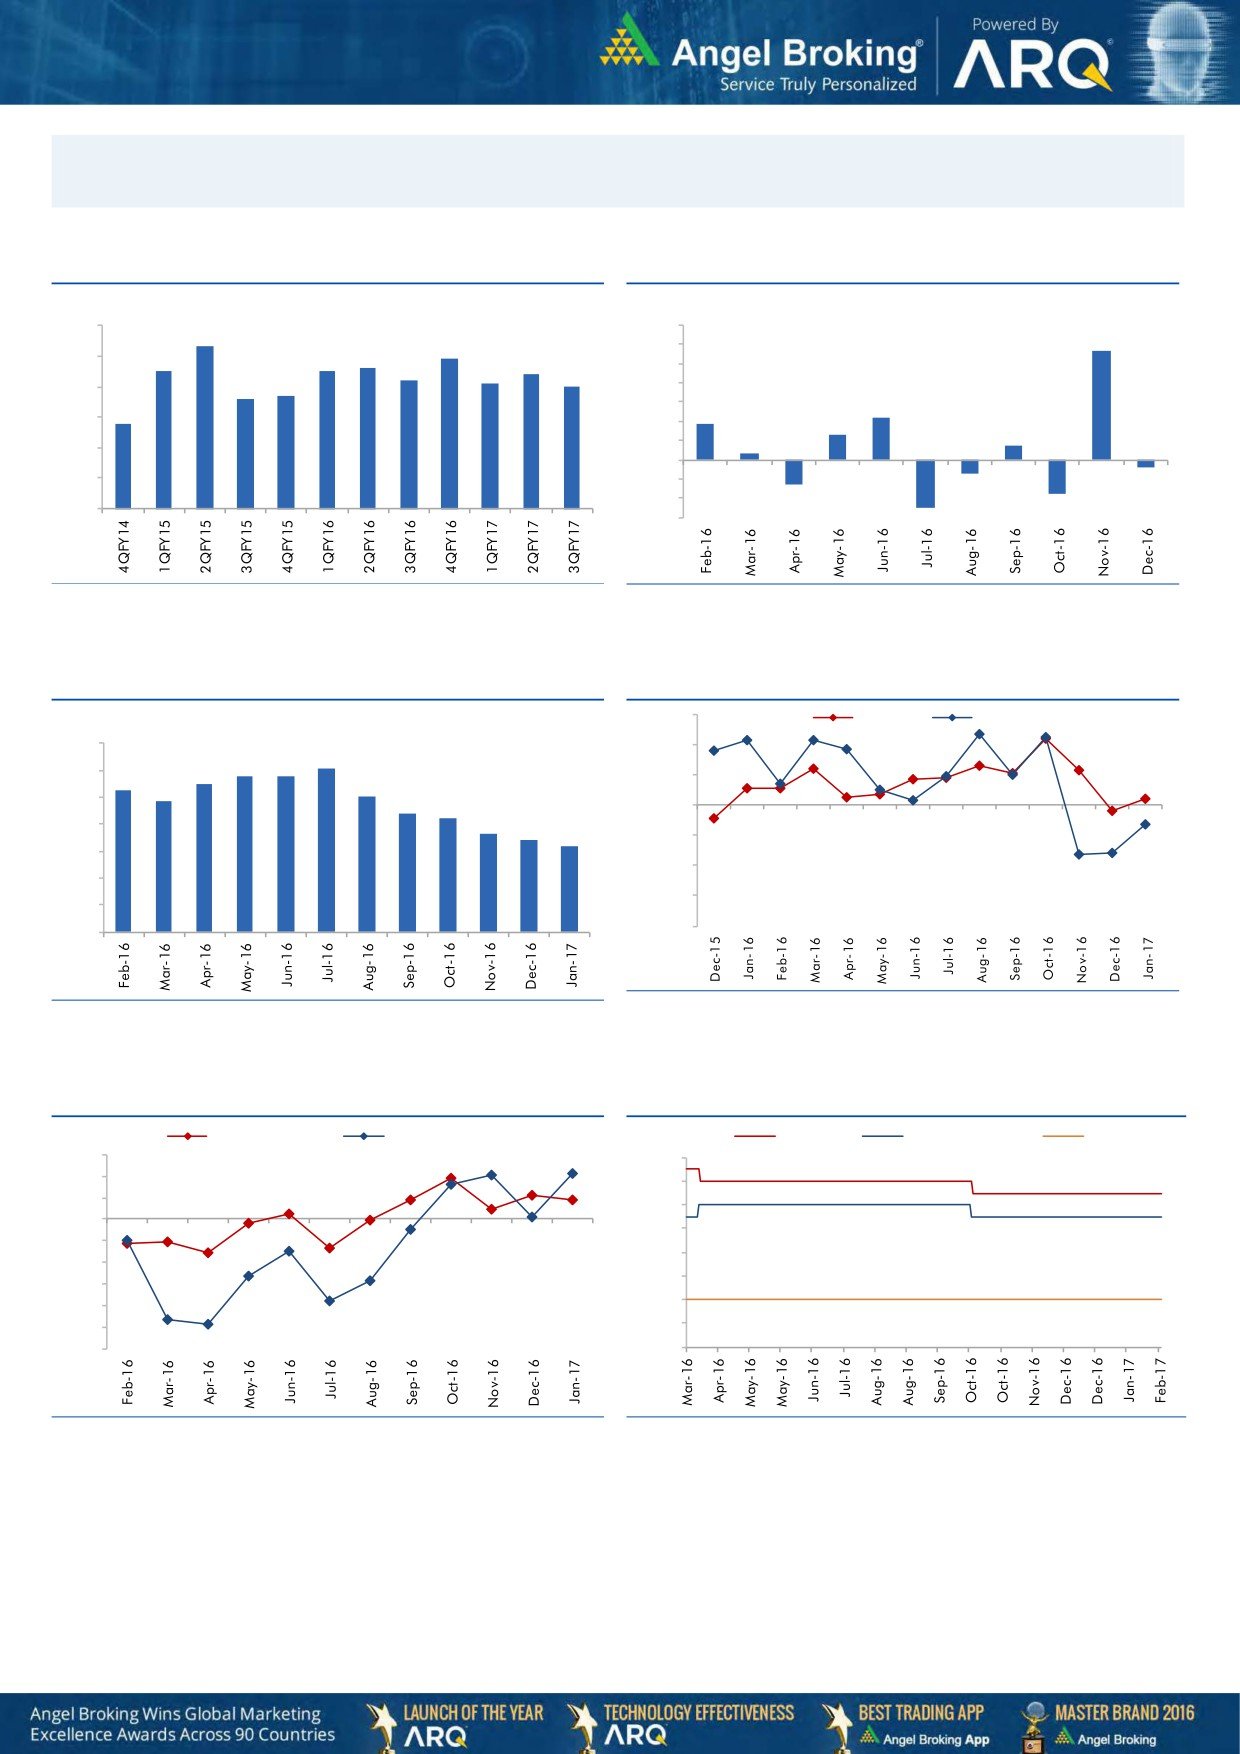
Macro watch
Exhibit 1: Quarterly GDP trends
Exhibit 2: IIP trends
(%)
(%)
9.0
8.3
7.0
5.7
7.9
6.0
8.0
7.5
7.5
7.6
7.4
7.2
5.0
7.1
7.0
6.6
6.7
4.0
7.0
3.0
2.2
5.8
1.9
6.0
2.0
1.3
0.7
1.0
0.3
5.0
-
4.0
(1.0)
(0.7)
(0.4)
(2.0)
3.0
(1.3)
(3.0)
(1.8)
(2.5)
Source: CSO, Angel Research
Source: MOSPI, Angel Research
Exhibit 3: Monthly CPI inflation trends
Exhibit 4: Manufacturing and services PMI
56.0
Mfg. PMI
Services PMI
(%)
7.0
54.0
6.1
5.8
5.8
6.0
5.3
5.5
5.1
52.0
4.8
5.0
4.4
4.2
50.0
3.6
4.0
3.4
3.2
48.0
3.0
46.0
2.0
44.0
1.0
42.0
-
Source: Market, Angel Research; Note: Level above 50 indicates expansion
Source: MOSPI, Angel Research
Exhibit 5: Exports and imports growth trends
Exhibit 6: Key policy rates
(%)
Exports yoy growth
Imports yoy growth
(%)
Repo rate
Reverse Repo rate
CRR
15.0
7.00
10.0
6.50
5.0
6.00
0.0
5.50
(5.0)
5.00
(10.0)
4.50
(15.0)
4.00
(20.0)
(25.0)
3.50
(30.0)
3.00
Source: Bloomberg, Angel Research
Source: RBI, Angel Research
Market Outlook
March 01, 2017
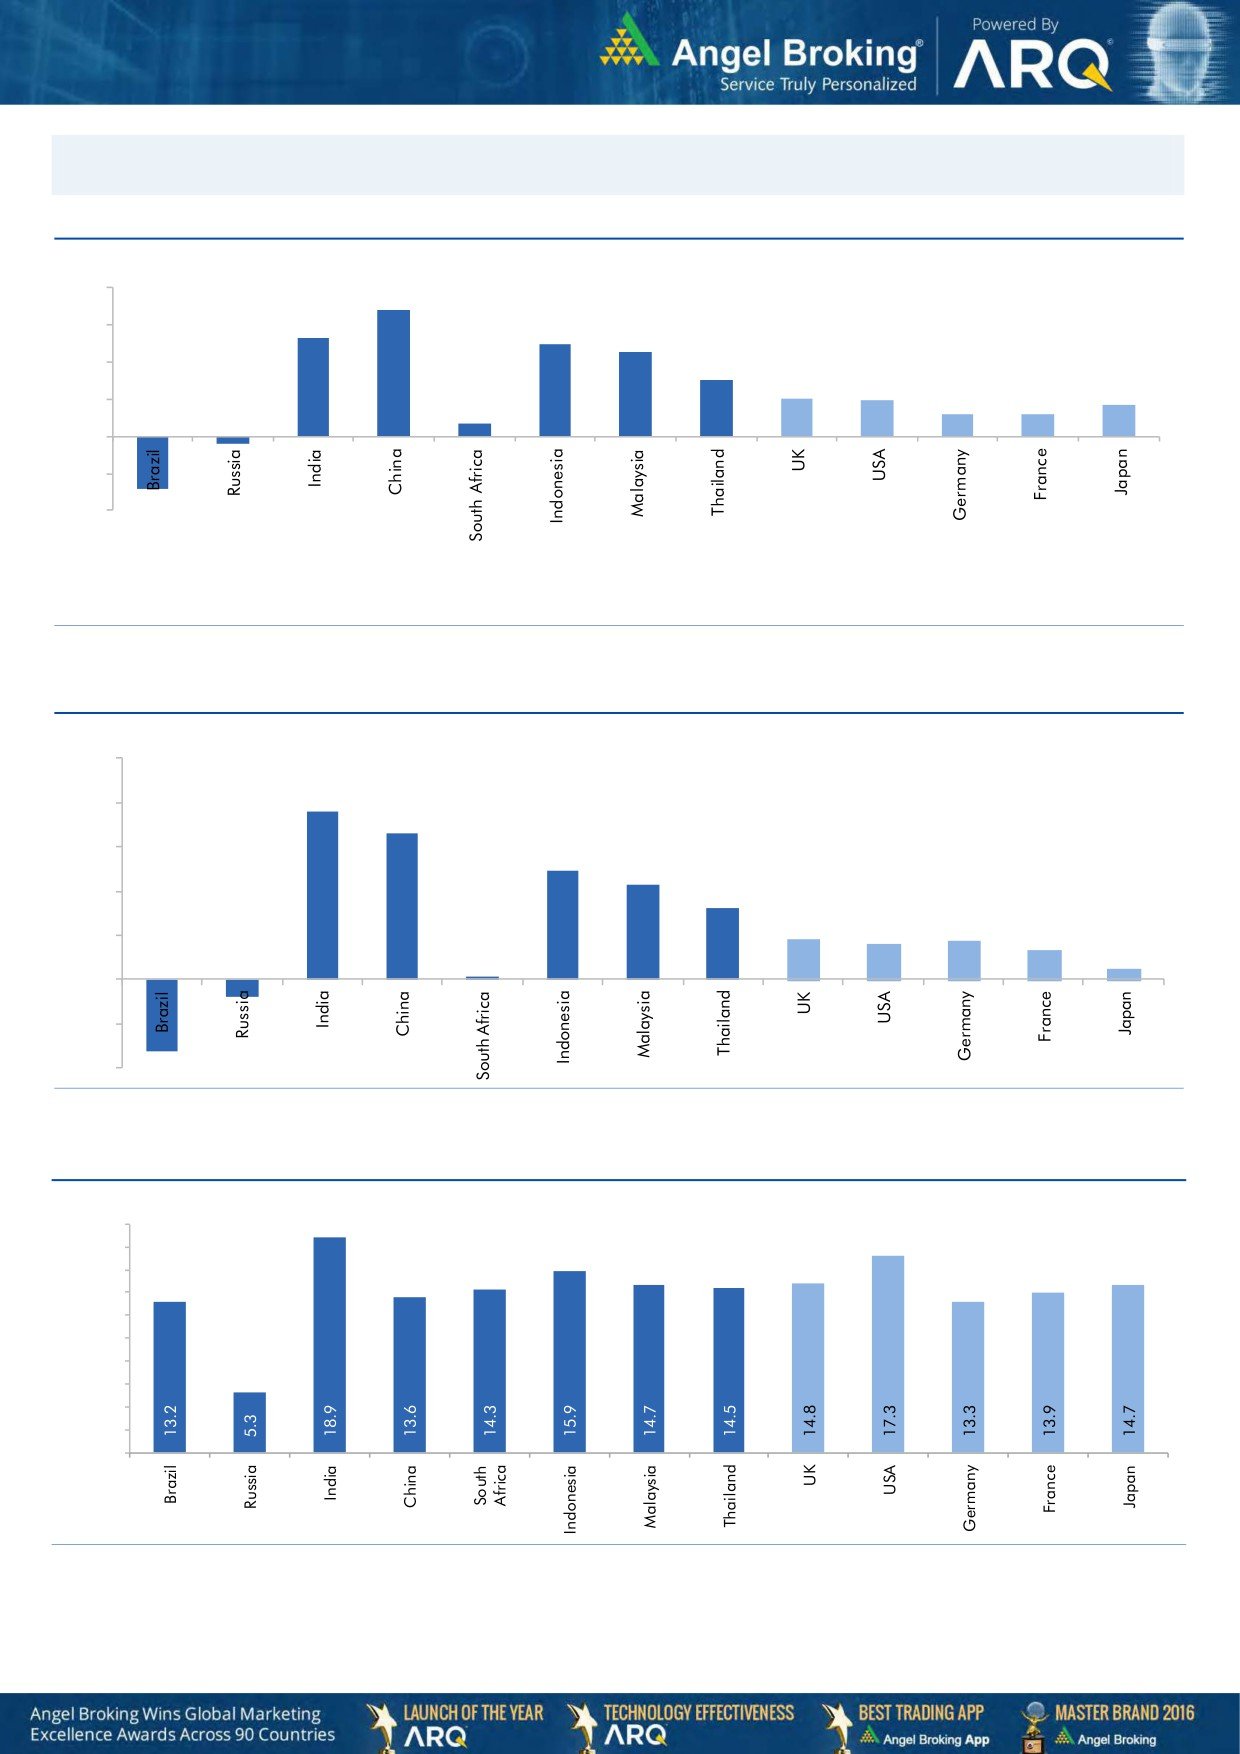
Global watch
Exhibit 1: Latest quarterly GDP Growth (%, yoy) across select developing and developed countries
(%)
8.0
6.8
0.7
5.3
6.0
4.9
4.5
4.0
3.0
2.0
1.9
1.2
1.2
1.7
2.0
-
(2.0)
(0.4)
(4.0)
(2.9)
Source: Bloomberg, Angel Research
Exhibit 2: 2016 GDP Growth projection by IMF (%, yoy) across select developing and developed countries
(%)
10.0
7.6
8.0
6.6
6.0
4.9
4.3
4.0
3.2
1.8
1.7
1.6
2.0
1.3
(0.8)
0.5
(3.3)
0.1
-
(2.0)
(4.0)
Source: IMF, Angel Research
Exhibit 3: One year forward P-E ratio across select developing and developed countries
(x)
20.0
18.0
16.0
14.0
12.0
10.0
8.0
6.0
4.0
2.0
-
Source: IMF, Angel Research
Market Outlook
March 01, 2017
Exhibit 4: Relative performance of indices across globe
Returns (%)
Country
Name of index
Closing price
1M
3M
1YR
Brazil
Bovespa
66,662
1.2
8.6
60.3
Russia
Micex
2,036
(8.7)
(2.8)
11.1
India
Nifty
8,880
3.2
9.3
22.7
China
Shanghai Composite
3,242
3.4
0.1
13.4
South Africa
Top 40
44,131
(4.4)
0.1
3.2
Mexico
Mexbol
46,857
(1.6)
3.0
5.0
Indonesia
LQ45
893
0.5
4.3
9.9
Malaysia
KLCI
1,694
0.8
4.0
1.0
Thailand
SET 50
978
(2.0)
4.8
20.2
USA
Dow Jones
20,812
3.5
9.1
23.4
UK
FTSE
7,263
1.1
6.2
18.2
Japan
Nikkei
19,119
(1.8)
4.3
19.7
Germany
DAX
11,834
0.2
11.4
21.0
France
CAC
4,859
0.4
6.7
9.8
Source: Bloomberg, Angel Research
Stock Watch
March 01, 2017
Company Name
Reco
CMP
Target
Mkt Cap
Sales ( Čcr )
OPM(%)
EPS (Č)
PER(x)
P/BV(x)
RoE(%)
EV/Sales(x)
(Č)
Price ( Č)
( Č cr )
FY17E FY18E
FY17E
FY18E
FY17E
FY18E
FY17E
FY18E
FY17E
FY18E
FY17E
FY18E
FY17E
FY18E
Agri / Agri Chemical
Rallis
Neutral
234
-
4,553
1,937
2,164
13.3
14.3
9.0
11.0
26.0
21.3
4.5
4.0
18.4
19.8
2.4
2.1
United Phosphorus
Neutral
718
-
36,407
15,176
17,604
18.5
18.5
37.4
44.6
19.2
16.1
3.8
3.1
21.4
21.2
2.5
2.1
Auto & Auto Ancillary
Ashok Leyland
Buy
91
111
25,769
20,021
21,915
11.6
11.9
4.5
5.3
20.1
17.0
4.1
3.7
20.6
21.5
1.2
1.1
Bajaj Auto
Neutral
2,758
-
79,815
25,093
27,891
19.5
19.2
143.9
162.5
19.2
17.0
5.4
4.6
30.3
29.4
2.9
2.5
Bharat Forge
Neutral
1,051
-
24,475
7,726
8,713
20.5
21.2
35.3
42.7
29.8
24.6
5.5
5.0
18.9
20.1
3.2
2.8
Eicher Motors
Neutral
24,130
-
65,659
16,583
20,447
17.5
18.0
598.0
745.2
40.4
32.4
13.8
10.5
41.2
38.3
3.8
3.0
Gabriel India
Accumulate
114
130
1,639
1,544
1,715
9.0
9.3
5.4
6.3
21.1
18.1
4.0
3.5
18.9
19.5
1.0
0.9
Hero Motocorp
Accumulate
3,135
3,446
62,605
28,083
30,096
15.3
15.7
171.8
187.0
18.2
16.8
6.4
5.4
30.1
27.9
2.1
1.9
Jamna Auto Industries Neutral
207
-
1,648
1,486
1,620
9.8
9.9
15.0
17.2
13.8
12.0
3.0
2.6
21.8
21.3
1.2
1.1
L G Balakrishnan & Bros Neutral
567
-
889
1,302
1,432
11.6
11.9
43.7
53.0
13.0
10.7
1.8
1.7
13.8
14.2
0.8
0.7
Mahindra and Mahindra Neutral
1,307
-
81,174
46,534
53,077
11.6
11.7
67.3
78.1
19.4
16.7
3.2
2.8
15.4
15.8
1.7
1.5
Maruti
Accumulate
5,923
6,560
178,918
67,822
83,288
16.0
16.4
253.8
312.4
23.3
19.0
5.4
4.3
23.0
22.9
2.3
1.8
Minda Industries
Neutral
440
-
3,486
2,728
3,042
9.0
9.1
68.2
86.2
6.4
5.1
1.5
1.2
23.8
24.3
1.3
1.2
Motherson Sumi
Neutral
350
-
49,084
45,896
53,687
7.8
8.3
13.0
16.1
26.8
21.7
8.6
6.9
34.7
35.4
1.1
1.0
Rane Brake Lining
Neutral
974
-
771
511
562
11.3
11.5
28.1
30.9
34.7
31.5
5.3
4.8
15.3
15.0
1.6
1.5
Setco Automotive
Neutral
38
-
504
741
837
13.0
13.0
15.2
17.0
2.5
2.2
0.4
0.4
15.8
16.3
1.1
1.0
Tata Motors
Neutral
456
-
131,706
300,209
338,549
8.9
8.4
42.7
54.3
10.7
8.4
1.7
1.4
15.6
17.2
0.6
0.5
TVS Motor
Neutral
428
-
20,355
13,390
15,948
6.9
7.1
12.8
16.5
33.6
25.9
8.4
6.6
26.3
27.2
1.6
1.3
Amara Raja Batteries
Buy
859
1,009
14,664
5,305
6,100
16.0
16.3
28.4
34.0
30.2
25.3
5.8
4.9
19.3
19.3
2.8
2.4
Exide Industries
Neutral
212
-
18,003
7,439
8,307
15.0
15.0
8.1
9.3
26.2
22.8
3.7
3.3
14.3
16.7
2.0
1.8
Apollo Tyres
Buy
188
235
9,549
12,877
14,504
14.3
13.9
21.4
23.0
8.8
8.2
1.4
1.2
16.4
15.2
0.9
0.8
Ceat
Buy
1,181
1,450
4,779
7,524
8,624
13.0
12.7
131.1
144.3
9.0
8.2
1.7
1.4
19.8
18.6
0.7
0.6
JK Tyres
Neutral
124
-
2,820
7,455
8,056
15.0
15.0
21.8
24.5
5.7
5.1
1.2
1.0
22.8
21.3
0.5
0.4
Swaraj Engines
Neutral
1,383
-
1,717
660
810
15.2
16.4
54.5
72.8
25.4
19.0
7.9
7.2
31.5
39.2
2.4
2.0
Subros
Neutral
197
-
1,184
1,488
1,681
11.7
11.9
6.4
7.2
30.8
27.5
3.3
3.0
10.8
11.4
1.0
0.9
Indag Rubber
Neutral
189
-
497
286
326
19.8
16.8
11.7
13.3
16.2
14.2
2.7
2.6
17.8
17.1
1.4
1.2
Capital Goods
ACE
Neutral
55
-
542
709
814
4.1
4.6
1.4
2.1
39.1
26.1
1.6
1.5
4.4
6.0
0.9
0.8
BEML
Neutral
1,340
-
5,578
3,451
4,055
6.3
9.2
31.4
57.9
42.7
23.1
2.6
2.3
6.3
10.9
1.7
1.5
Bharat Electronics
Neutral
1,516
-
33,853
8,137
9,169
16.8
17.2
58.7
62.5
25.8
24.3
4.0
3.6
44.6
46.3
3.1
2.8
Stock Watch
March 01, 2017
Company Name
Reco
CMP
Target
Mkt Cap
Sales ( Čcr )
OPM(%)
EPS (Č)
PER(x)
P/BV(x)
RoE(%)
EV/Sales(x)
(Č)
Price ( Č)
( Č cr )
FY17E
FY18E
FY17E
FY18E
FY17E
FY18E
FY17E
FY18E
FY17E
FY18E
FY17E
FY18E
FY17E
FY18E
Capital Goods
Voltas
Accumulate
372
407
12,309
6,511
7,514
7.9
8.7
12.9
16.3
28.8
22.8
5.2
4.6
16.7
18.5
1.6
1.4
BGR Energy
Neutral
138
-
995
16,567
33,848
6.0
5.6
7.8
5.9
17.7
23.4
1.0
1.0
4.7
4.2
0.2
0.1
BHEL
Neutral
162
-
39,651
28,797
34,742
-
2.8
2.3
6.9
70.4
23.5
1.2
1.2
1.3
4.8
1.0
0.7
Blue Star
Accumulate
565
634
5,399
4,283
5,077
5.9
7.3
14.9
22.1
38.0
25.5
7.4
6.2
20.4
26.4
1.3
1.1
Crompton Greaves
Neutral
69
-
4,321
5,777
6,120
5.9
7.0
3.3
4.5
20.9
15.3
0.9
0.9
4.4
5.9
0.7
0.6
Greaves Cotton
Neutral
164
-
4,005
1,755
1,881
16.8
16.9
7.8
8.5
21.0
19.3
4.2
3.9
20.6
20.9
2.0
1.8
Inox Wind
Neutral
172
-
3,818
5,605
6,267
15.7
16.4
24.8
30.0
6.9
5.7
1.9
1.4
25.9
24.4
0.7
0.6
KEC International
Neutral
166
-
4,279
9,294
10,186
7.9
8.1
9.9
11.9
16.8
14.0
2.5
2.1
15.6
16.3
0.7
0.6
KEI Industries
Buy
179
207
1,389
2,682
3,058
10.4
10.0
11.7
12.8
15.2
13.9
3.1
2.5
20.1
18.2
0.7
0.6
Thermax
Neutral
861
-
10,259
5,421
5,940
7.3
7.3
25.7
30.2
33.5
28.5
4.1
3.7
12.2
13.1
1.8
1.6
VATech Wabag
Buy
575
681
3,135
3,136
3,845
8.9
9.1
26.0
35.9
22.1
16.0
2.8
2.4
13.4
15.9
0.9
0.7
Cement
ACC
Neutral
1,411
-
26,501
11,225
13,172
13.2
16.9
44.5
75.5
31.7
18.7
3.0
2.8
11.2
14.2
2.4
2.0
Ambuja Cements
Neutral
229
-
45,432
9,350
10,979
18.2
22.5
5.8
9.5
39.5
24.1
3.3
3.0
10.2
12.5
4.9
4.1
India Cements
Neutral
170
-
5,225
4,364
4,997
18.5
19.2
7.9
11.3
21.5
15.1
1.6
1.5
8.0
8.5
2.0
1.7
JK Cement
Neutral
884
-
6,181
4,398
5,173
15.5
17.5
31.2
55.5
28.3
15.9
3.4
3.0
12.0
15.5
2.0
1.6
J K Lakshmi Cement
Neutral
411
-
4,832
2,913
3,412
14.5
19.5
7.5
22.5
54.8
18.3
3.4
2.8
12.5
18.0
2.2
1.9
Orient Cement
Neutral
154
-
3,161
2,114
2,558
18.5
20.5
8.1
11.3
19.1
13.7
2.8
2.4
9.0
14.0
2.1
1.7
UltraTech Cement
Neutral
3,772
-
103,548
25,768
30,385
21.0
23.5
111.0
160.0
34.0
23.6
4.3
3.8
13.5
15.8
4.1
3.4
Construction
ITNL
Neutral
102
-
3,364
8,946
10,017
31.0
31.6
8.1
9.1
12.6
11.2
0.5
0.5
4.2
5.0
3.7
3.4
KNR Constructions
Neutral
180
-
2,530
1,385
1,673
14.7
14.0
41.2
48.5
4.4
3.7
0.8
0.7
14.9
15.2
1.9
1.6
Larsen & Toubro
Accumulate
1,470
1,634
137,169
111,017
124,908
11.0
11.0
61.1
66.7
24.1
22.0
2.9
2.7
13.1
12.9
2.3
2.1
Gujarat Pipavav Port
Neutral
153
-
7,382
705
788
52.2
51.7
5.0
5.6
30.5
27.3
3.0
2.7
11.2
11.2
10.1
8.6
Nagarjuna Const.
Neutral
84
-
4,645
8,842
9,775
9.1
8.8
5.3
6.4
15.8
13.1
1.3
1.1
8.2
9.1
0.7
0.6
PNC Infratech
Buy
101
143
2,596
2,350
2,904
13.1
13.2
9.0
8.8
11.2
11.5
0.4
0.4
15.9
13.9
1.2
1.0
Simplex Infra
Neutral
297
-
1,469
6,829
7,954
10.5
10.5
31.4
37.4
9.5
7.9
1.0
0.9
9.9
13.4
0.6
0.5
Power Mech Projects
Neutral
434
-
639
1,801
2,219
12.7
14.6
72.1
113.9
6.0
3.8
1.1
0.9
16.8
11.9
0.4
0.3
Sadbhav Engineering
Accumulate
277
298
4,760
3,598
4,140
10.3
10.6
9.0
11.9
30.8
23.3
3.2
2.8
9.9
11.9
1.6
1.4
NBCC
Neutral
169
-
15,197
7,428
9,549
7.9
8.6
8.2
11.0
20.6
15.4
1.0
0.8
28.2
28.7
1.8
1.3
MEP Infra
Neutral
46
-
740
1,877
1,943
30.6
29.8
3.0
4.2
15.2
10.8
7.3
5.0
0.6
0.6
1.8
1.6
Stock Watch
March 01, 2017
Company Name
Reco
CMP
Target
Mkt Cap
Sales ( Čcr )
OPM(%)
EPS (Č)
PER(x)
P/BV(x)
RoE(%)
EV/Sales(x)
(Č)
Price ( Č)
( Č cr )
FY17E
FY18E
FY17E
FY18E
FY17E
FY18E
FY17E
FY18E
FY17E
FY18E
FY17E
FY18E
FY17E
FY18E
Construction
SIPL
Neutral
94
-
3,314
1,036
1,252
65.5
66.2
(8.4)
(5.6)
3.5
4.0
(22.8)
(15.9)
11.4
9.5
Engineers India
Neutral
151
-
10,145
1,725
1,935
16.0
19.1
11.4
13.9
13.2
10.8
1.8
1.8
13.4
15.3
4.8
4.3
Financials
Axis Bank
Accumulate
506
580
121,080
46,932
53,575
3.5
3.4
32.4
44.6
15.7
11.3
2.0
1.8
13.6
16.5
-
-
Bank of Baroda
Neutral
165
-
38,030
19,980
23,178
1.8
1.8
11.5
17.3
14.4
9.5
1.6
1.4
8.3
10.1
-
-
Canara Bank
Neutral
295
-
16,032
15,225
16,836
1.8
1.8
14.5
28.0
20.4
10.5
1.4
1.1
5.8
8.5
-
-
Can Fin Homes
Accumulate
1,935
2,128
5,151
420
526
3.5
3.5
86.5
107.8
22.4
18.0
4.8
3.9
23.6
24.1
-
-
Cholamandalam Inv. &
Buy
974
1,230
15,216
2,012
2,317
6.3
6.3
42.7
53.6
22.8
18.2
3.6
3.1
16.9
18.3
-
-
Fin. Co.
Dewan Housing Finance Accumulate
333
350
10,432
2,225
2,688
2.9
2.9
29.7
34.6
11.2
9.6
1.8
1.6
16.1
16.8
-
-
Equitas Holdings
Buy
177
235
5,981
939
1,281
11.7
11.5
5.8
8.2
30.6
21.6
2.6
2.3
10.9
11.5
-
-
Federal Bank
Neutral
87
-
15,037
8,259
8,995
3.0
3.0
4.3
5.6
20.3
15.6
1.7
1.6
8.5
10.1
-
-
HDFC
Neutral
1,369
-
217,082
11,475
13,450
3.4
3.4
45.3
52.5
30.2
26.1
5.8
5.2
20.2
20.5
-
-
HDFC Bank
Neutral
1,389
-
355,646
46,097
55,433
4.5
4.5
58.4
68.0
23.8
20.4
4.2
3.5
18.8
18.6
-
-
ICICI Bank
Accumulate
276
315
160,938
42,800
44,686
3.1
3.3
18.0
21.9
15.4
12.6
2.1
1.9
11.1
12.3
-
-
Lakshmi Vilas Bank
Accumulate
160
174
3,059
3,339
3,799
2.7
2.8
11.0
14.0
14.5
11.4
1.5
1.4
11.2
12.7
-
-
LIC Housing Finance
Accumulate
561
630
28,286
3,712
4,293
2.6
2.5
39.0
46.0
14.4
12.2
2.7
2.3
19.9
20.1
-
-
Punjab Natl.Bank
Neutral
141
-
30,079
23,532
23,595
2.3
2.4
6.8
12.6
20.8
11.2
3.2
2.3
3.3
6.5
-
-
RBL Bank
Neutral
477
-
17,629
1,783
2,309
2.6
2.6
12.7
16.4
37.5
29.1
4.1
3.7
12.8
13.3
-
-
South Ind.Bank
Neutral
21
-
2,812
6,435
7,578
2.5
2.5
2.7
3.1
7.7
6.7
1.0
0.8
10.1
11.2
-
-
St Bk of India
Neutral
269
-
214,647
88,650
98,335
2.6
2.6
13.5
18.8
19.9
14.3
1.9
1.7
7.0
8.5
-
-
Union Bank
Neutral
147
-
10,095
13,450
14,925
2.3
2.3
25.5
34.5
5.8
4.3
0.8
0.7
7.5
10.2
-
-
Yes Bank
Neutral
1,453
-
61,505
8,978
11,281
3.3
3.4
74.0
90.0
19.6
16.1
3.7
3.2
17.0
17.2
-
-
FMCG
Asian Paints
Neutral
1,024
-
98,265
17,128
18,978
16.8
16.4
19.1
20.7
53.6
49.5
18.7
17.6
34.8
35.5
5.7
5.1
Britannia
Accumulate
3,229
3,626
38,751
9,594
11,011
14.6
14.9
80.3
94.0
40.2
34.4
16.5
12.8
41.2
-
3.9
3.4
Colgate
Accumulate
901
995
24,492
4,605
5,149
23.4
23.4
23.8
26.9
37.8
33.5
20.9
16.4
64.8
66.8
5.2
4.7
Dabur India
Accumulate
276
304
48,592
8,315
9,405
19.8
20.7
8.1
9.2
34.1
30.0
9.5
7.9
31.6
31.0
5.5
4.8
GlaxoSmith Con*
Neutral
5,101
-
21,453
4,350
4,823
21.2
21.4
179.2
196.5
28.5
26.0
7.6
6.4
27.1
26.8
4.3
3.8
Godrej Consumer
Neutral
1,651
-
56,221
10,235
11,428
18.4
18.6
41.1
44.2
40.2
37.4
8.9
7.5
24.9
24.8
5.6
4.9
HUL
Neutral
865
-
187,188
35,252
38,495
17.8
17.8
20.7
22.4
41.9
38.6
40.0
34.3
95.6
88.9
5.2
4.7
ITC
Accumulate
262
284
317,999
40,059
44,439
38.3
39.2
9.0
10.1
29.2
25.9
8.1
7.1
27.8
27.5
7.4
6.7
Stock Watch
March 01, 2017
Company Name
Reco
CMP
Target
Mkt Cap
Sales ( Čcr )
OPM(%)
EPS (Č)
PER(x)
P/BV(x)
RoE(%)
EV/Sales(x)
(Č)
Price ( Č)
( Č cr )
FY17E FY18E
FY17E
FY18E
FY17E
FY18E
FY17E
FY18E
FY17E
FY18E
FY17E
FY18E
FY17E
FY18E
FMCG
Marico
Accumulate
281
300
36,195
6,430
7,349
18.8
19.5
6.4
7.7
43.8
36.4
13.2
11.1
33.2
32.5
5.4
4.7
Nestle*
Neutral
6,255
-
60,309
10,073
11,807
20.7
21.5
124.8
154.2
50.1
40.6
20.6
18.5
34.8
36.7
5.8
4.9
Tata Global
Neutral
138
-
8,713
8,675
9,088
9.8
9.8
7.4
8.2
18.7
16.8
2.1
2.0
7.9
8.1
0.9
0.9
Procter & Gamble
Neutral
7,110
-
23,080
2,939
3,342
23.2
23.0
146.2
163.7
48.6
43.4
108.9
104.4
25.3
23.5
7.4
6.4
Hygiene
IT
HCL Tech^
Buy
840
1,000
118,555
49,242
57,168
20.5
20.5
55.7
64.1
15.1
13.1
3.1
2.4
20.3
17.9
2.3
1.8
Infosys
Buy
1,012
1,249
232,520
68,350
77,326
27.0
27.0
62.5
69.4
16.2
14.6
3.5
3.2
21.3
21.6
2.8
2.5
TCS
Accumulate
2,467
2,700
486,006
119,025
133,308
27.6
27.6
131.2
145.5
18.8
17.0
6.1
5.6
32.4
33.1
3.9
3.4
Tech Mahindra
Buy
500
600
48,657
29,673
32,937
15.5
17.0
32.8
39.9
15.2
12.5
3.0
2.6
19.6
20.7
1.4
1.2
Wipro
Buy
489
583
118,749
55,440
60,430
18.1
18.1
36.1
38.9
13.5
12.6
2.4
2.2
19.0
17.6
1.9
1.6
Media
D B Corp
Neutral
379
-
6,970
2,297
2,590
27.4
28.2
21.0
23.4
18.1
16.2
4.2
3.6
23.7
23.1
2.8
2.4
HT Media
Neutral
85
-
1,983
2,693
2,991
12.6
12.9
7.9
9.0
10.8
9.5
0.9
0.8
7.8
8.3
0.3
0.2
Jagran Prakashan
Buy
187
225
6,099
2,355
2,635
28.0
28.0
10.8
12.5
17.3
14.9
3.7
3.2
21.7
21.7
2.6
2.3
Sun TV Network
Neutral
713
-
28,094
2,850
3,265
70.1
71.0
26.2
30.4
27.2
23.5
7.0
6.2
24.3
25.6
9.5
8.1
Hindustan Media
Neutral
272
-
1,997
1,016
1,138
24.3
25.2
27.3
30.1
10.0
9.0
1.9
1.7
16.2
15.8
1.3
1.1
Ventures
TV Today Network
Buy
260
385
1,551
637
743
27.5
27.5
18.4
21.4
14.1
12.2
2.5
2.1
17.4
17.2
2.0
1.7
Metals & Mining
Coal India
Neutral
322
-
199,754
84,638
94,297
21.4
22.3
24.5
27.1
13.1
11.9
5.5
5.2
42.6
46.0
1.9
1.7
Hind. Zinc
Neutral
308
-
130,161
14,252
18,465
55.9
48.3
15.8
21.5
19.5
14.3
3.2
2.8
17.0
20.7
9.1
7.1
Hindalco
Neutral
184
-
38,042
107,899
112,095
7.4
8.2
9.2
13.0
20.0
14.2
1.0
0.9
4.8
6.6
0.9
0.8
JSW Steel
Neutral
187
-
45,130
53,201
58,779
16.1
16.2
130.6
153.7
1.4
1.2
0.2
0.2
14.0
14.4
1.6
1.4
NMDC
Neutral
150
-
47,458
6,643
7,284
44.4
47.7
7.1
7.7
21.1
19.5
1.8
1.8
8.8
9.2
4.9
4.4
SAIL
Neutral
61
-
25,235
47,528
53,738
(0.7)
2.1
(1.9)
2.6
23.5
0.7
0.6
(1.6)
3.9
1.4
1.3
Vedanta
Neutral
259
-
76,815
71,744
81,944
19.2
21.7
13.4
20.1
19.3
12.9
1.7
1.5
8.4
11.3
1.5
1.1
Tata Steel
Neutral
483
-
46,876
121,374
121,856
7.2
8.4
18.6
34.3
26.0
14.1
1.6
1.5
6.1
10.1
1.0
1.0
Oil & Gas
Cairn India
Neutral
283
-
53,163
9,127
10,632
4.3
20.6
8.8
11.7
32.2
24.2
1.0
1.0
3.3
4.2
7.3
6.1
GAIL
Neutral
517
-
65,593
56,220
65,198
9.3
10.1
27.1
33.3
19.1
15.5
1.7
1.6
9.3
10.7
1.4
1.1
ONGC
Neutral
193
-
248,195
137,222
152,563
15.0
21.8
19.5
24.1
9.9
8.0
0.9
0.8
8.5
10.1
2.1
1.9
Indian Oil Corp
Neutral
385
-
186,977
373,359
428,656
5.9
5.5
54.0
59.3
7.1
6.5
1.1
1.0
16.0
15.6
0.7
0.6
Reliance Industries
Neutral
1,238
-
401,671
301,963
358,039
12.1
12.6
87.7
101.7
14.1
12.2
1.5
1.3
10.7
11.3
1.8
1.5
Pharmaceuticals
Alembic Pharma
Neutral
580
-
10,933
3,483
4,083
20.2
21.4
24.3
30.4
23.9
19.1
5.4
4.3
25.5
25.3
3.1
2.5
Stock Watch
March 01, 2017
Company Name
Reco
CMP
Target
Mkt Cap
Sales ( Čcr )
OPM(%)
EPS (Č)
PER(x)
P/BV(x)
RoE(%)
EV/Sales(x)
(Č)
Price ( Č)
( Č cr )
FY17E
FY18E
FY17E
FY18E
FY17E
FY18E
FY17E
FY18E
FY17E
FY18E
FY17E
FY18E
FY17E
FY18E
Pharmaceuticals
Alkem Laboratories Ltd
Neutral
2,142
-
25,605
6,065
7,009
18.7
20.0
80.2
92.0
26.7
23.3
6.0
5.0
22.5
21.6
4.2
3.6
Aurobindo Pharma
Buy
677
877
39,628
15,720
18,078
23.7
23.7
41.4
47.3
16.4
14.3
4.3
3.3
29.6
26.1
2.7
2.4
Aventis*
Neutral
4,127
-
9,504
2,277
2,597
17.3
18.3
149.4
172.0
27.6
24.0
4.6
3.7
25.1
28.8
3.8
3.1
Cadila Healthcare
Neutral
440
-
45,060
10,429
12,318
17.7
21.6
13.1
19.2
33.6
22.9
7.0
5.6
22.8
27.1
4.4
3.6
Cipla
Sell
583
465
46,917
15,378
18,089
15.7
16.8
19.3
24.5
30.2
23.8
3.5
3.1
12.3
13.9
3.2
2.7
Dr Reddy's
Neutral
2,854
-
47,280
16,043
18,119
18.0
23.0
78.6
130.9
36.3
21.8
3.5
3.1
10.1
15.2
2.7
2.6
Dishman Pharma
Neutral
231
-
3,723
1,718
1,890
22.7
22.8
9.5
11.3
24.3
20.4
2.4
2.1
10.1
10.9
2.6
2.3
GSK Pharma*
Neutral
2,674
-
22,653
2,800
3,290
10.2
20.6
32.2
60.3
83.1
44.4
15.4
15.2
17.2
34.5
7.9
6.7
Indoco Remedies
Reduce
269
240
2,475
1,112
1,289
16.2
18.2
11.6
16.0
23.2
16.8
3.7
3.1
17.0
20.1
2.4
2.0
Ipca labs
Accumulate
554
613
6,986
3,258
3,747
12.8
15.3
12.1
19.2
45.8
28.8
2.9
2.6
6.4
9.5
2.3
2.0
Lupin
Buy
1,472
1,809
66,480
15,912
18,644
26.4
26.7
58.1
69.3
25.3
21.3
4.9
4.0
21.4
20.9
4.3
3.5
Sun Pharma
Buy
679
847
162,894
31,129
35,258
32.0
32.9
30.2
35.3
22.5
19.2
3.7
3.0
20.0
20.1
4.8
4.1
Power
Tata Power
Neutral
83
-
22,341
36,916
39,557
17.4
27.1
5.1
6.3
16.2
13.1
1.4
1.3
9.0
10.3
1.6
1.5
NTPC
Neutral
163
-
134,484
86,605
95,545
17.5
20.8
11.8
13.4
13.8
12.2
1.4
1.3
10.5
11.1
2.9
2.9
Power Grid
Buy
192
223
100,447
25,315
29,193
88.2
88.7
14.2
17.2
13.6
11.2
2.1
1.8
15.2
16.1
8.6
7.8
Real Estate
Prestige Estate
Buy
171
210
6,407
4,707
5,105
25.2
26.0
10.3
13.0
16.6
13.1
1.3
1.2
10.3
10.2
2.5
2.2
MLIFE
Buy
345
522
1,415
1,152
1,300
22.7
24.6
29.9
35.8
11.5
9.6
0.9
0.8
7.6
8.6
1.9
1.6
Telecom
Bharti Airtel
Neutral
365
-
145,965
105,086
114,808
34.5
34.7
12.2
16.4
29.9
22.3
2.0
1.9
6.8
8.4
2.3
2.0
Idea Cellular
Neutral
115
-
41,582
40,133
43,731
37.2
37.1
6.4
6.5
18.0
17.8
1.5
1.4
8.2
7.6
2.1
1.8
zOthers
Abbott India
Neutral
4,482
-
9,525
3,153
3,583
14.1
14.4
152.2
182.7
29.5
24.5
144.6
123.5
25.6
26.1
2.7
2.3
Asian Granito
Buy
284
351
855
1,060
1,169
12.2
12.5
12.7
15.9
22.4
17.9
2.1
1.9
9.5
10.7
1.1
1.0
Bajaj Electricals
Accumulate
260
295
2,635
4,801
5,351
5.7
6.2
10.4
13.7
25.0
19.0
3.1
2.8
12.4
14.5
0.5
0.5
Banco Products (India)
Neutral
204
-
1,459
1,353
1,471
12.3
12.4
14.5
16.3
14.1
12.5
19.4
17.5
14.5
14.6
1.0
109.2
Coffee Day Enterprises
Neutral
236
-
4,861
2,964
3,260
20.5
21.2
4.7
8.0
-
29.5
2.7
2.5
5.5
8.5
2.1
1.8
Ltd
Competent Automobiles Neutral
170
-
105
1,137
1,256
3.1
2.7
28.0
23.6
6.1
7.2
32.7
29.6
14.3
11.5
0.1
0.1
Elecon Engineering
Neutral
54
-
602
1,482
1,660
13.7
14.5
3.9
5.8
13.8
9.3
3.2
3.0
7.8
10.9
0.7
0.6
Finolex Cables
Neutral
444
-
6,796
2,883
3,115
12.0
12.1
14.2
18.6
31.3
23.9
16.6
14.6
15.8
14.6
2.1
1.9
Garware Wall Ropes
Neutral
683
-
1,494
863
928
15.1
15.2
36.4
39.4
18.8
17.3
3.4
2.9
17.5
15.9
1.6
1.5
Goodyear India*
Neutral
712
-
1,642
1,598
1,704
10.4
10.2
49.4
52.6
14.4
13.5
66.5
58.4
18.2
17.0
0.7
98.9
Stock Watch
March 01, 2017
Company Name
Reco
CMP
Target
Mkt Cap
Sales ( Čcr )
OPM(%)
EPS (Č)
PER(x)
P/BV(x)
RoE(%)
EV/Sales(x)
(Č)
Price ( Č)
( Č cr )
FY17E
FY18E
FY17E
FY18E
FY17E
FY18E
FY17E
FY18E
FY17E
FY18E
FY17E
FY18E
FY17E
FY18E
zOthers
Hitachi
Neutral
1,407
-
3,825
2,081
2,433
8.8
8.9
33.4
39.9
42.1
35.3
34.0
28.3
22.1
21.4
1.8
1.5
HSIL
Neutral
311
-
2,246
2,384
2,515
15.8
16.3
15.3
19.4
20.3
16.0
20.2
17.4
7.8
9.3
1.1
1.0
Interglobe Aviation
Neutral
857
-
30,974
21,122
26,005
14.5
27.6
110.7
132.1
7.7
6.5
46.3
33.1
168.5
201.1
1.4
1.1
Jyothy Laboratories
Neutral
373
-
6,776
1,440
2,052
11.5
13.0
8.5
10.0
43.9
37.3
10.6
9.8
18.6
19.3
5.0
3.5
Kirloskar Engines India
Neutral
352
-
5,091
2,554
2,800
9.9
10.0
10.5
12.1
33.5
29.1
14.0
13.2
10.7
11.7
1.6
1.5
Ltd
Linc Pen & Plastics
Neutral
260
-
385
382
420
9.3
9.5
13.5
15.7
19.3
16.6
3.3
2.9
17.1
17.3
1.1
1.0
M M Forgings
Neutral
465
-
561
546
608
20.4
20.7
41.3
48.7
11.3
9.5
63.7
56.4
16.6
17.0
0.9
0.8
Manpasand Bever.
Neutral
722
-
4,129
836
1,087
19.6
19.4
16.9
23.8
42.7
30.3
5.1
4.5
12.0
14.8
4.7
3.5
Mirza International
Buy
92
107
1,110
1,024
1,148
18.0
18.0
6.9
8.0
13.4
11.5
2.3
1.9
16.6
16.3
1.3
1.1
MT Educare
Neutral
96
-
383
366
417
17.7
18.2
9.4
10.8
10.3
8.9
2.3
2.0
22.2
22.3
0.9
0.8
Narayana Hrudaya
Neutral
325
-
6,642
1,873
2,166
11.5
11.7
2.6
4.0
122.9
82.0
7.5
6.8
6.1
8.3
3.6
3.1
Navkar Corporation
Buy
166
265
2,362
369
561
42.9
42.3
7.2
11.5
22.9
14.4
1.7
1.5
7.4
10.5
7.4
4.9
Navneet Education
Neutral
144
-
3,363
1,062
1,147
24.0
24.0
6.1
6.6
23.6
21.7
4.9
4.3
20.6
19.8
3.2
3.0
Nilkamal
Neutral
1,931
-
2,882
1,995
2,165
10.7
10.4
69.8
80.6
27.7
24.0
110.4
95.9
16.6
16.5
1.4
1.3
Page Industries
Neutral
14,284
-
15,932
2,450
3,124
20.1
17.6
299.0
310.0
47.8
46.1
318.1
242.8
47.1
87.5
6.6
5.2
Parag Milk Foods
Neutral
225
-
1,889
1,919
2,231
9.3
9.6
9.5
12.9
23.8
17.4
3.7
3.0
15.5
17.5
1.1
1.0
Quick Heal
Neutral
248
-
1,739
408
495
27.3
27.0
7.7
8.8
32.0
28.2
3.0
3.0
9.3
10.6
3.4
2.8
Radico Khaitan
Accumulate
130
147
1,733
1,667
1,824
13.0
13.2
6.7
8.2
19.6
15.9
1.8
1.6
9.0
10.2
1.4
1.3
Relaxo Footwears
Neutral
421
-
5,058
2,085
2,469
9.2
8.2
7.6
8.0
55.7
53.0
21.6
18.4
17.9
18.8
2.5
2.2
S H Kelkar & Co.
Neutral
298
-
4,304
1,036
1,160
15.1
15.0
6.1
7.2
48.7
41.5
5.2
4.8
10.7
11.5
4.0
3.6
Siyaram Silk Mills
Neutral
1,682
-
1,577
1,652
1,857
11.6
11.7
92.4
110.1
18.2
15.3
2.7
2.3
14.7
15.2
1.2
1.0
Styrolution ABS India*
Neutral
607
-
1,067
1,440
1,537
9.2
9.0
40.6
42.6
15.0
14.3
38.2
34.7
12.3
11.6
0.7
0.6
Surya Roshni
Neutral
186
-
815
3,342
3,625
7.8
7.5
17.3
19.8
10.8
9.4
20.4
16.4
10.5
10.8
0.5
0.5
Team Lease Serv.
Neutral
852
-
1,457
3,229
4,001
1.5
1.8
22.8
32.8
37.4
25.9
4.0
3.5
10.7
13.4
0.4
0.3
The Byke Hospitality
Neutral
171
-
687
287
384
20.5
20.5
7.6
10.7
22.5
16.0
4.7
3.8
20.7
23.5
2.4
1.8
Transport Corporation of
Neutral
210
-
1,609
2,671
2,911
8.5
8.8
13.9
15.7
15.2
13.4
2.1
1.9
13.7
13.8
0.7
0.7
India
TVS Srichakra
Neutral
3,017
-
2,310
2,304
2,614
13.7
13.8
231.1
266.6
13.1
11.3
339.0
266.9
33.9
29.3
1.0
0.9
UFO Moviez
Neutral
403
-
1,113
619
685
33.2
33.4
30.0
34.9
13.5
11.6
1.9
1.6
13.8
13.9
1.5
1.2
Visaka Industries
Neutral
235
-
374
1,051
1,138
10.3
10.4
21.0
23.1
11.2
10.2
30.2
28.2
9.0
9.2
0.6
0.6
Stock Watch
March 01, 2017
Company Name
Reco
CMP
Target Mkt Cap
Sales ( Čcr )
OPM(%)
EPS (Č)
PER(x)
P/BV(x)
RoE(%)
EV/Sales(x)
(Č)
Price ( Č)
( Č cr )
FY17E FY18E FY17E FY18E FY17E FY18E FY17E FY18E FY17E FY18E FY17E FY18E FY17E FY18E
zOthers
VRL Logistics
Neutral
293
-
2,671
1,902
2,119
16.7
16.6
14.6
16.8
20.1
17.4
4.4
3.9
21.9
22.2
1.5
1.3
Wonderla Holidays
Neutral
375
-
2,116
287
355
38.0
40.0
11.3
14.2
33.1
26.4
4.8
4.2
21.4
23.9
7.1
5.7
Source: Company, Angel Research; Note: *December year end; #September year end; &October year end; Price as on February 28, 2017
Market Outlook
March 01, 2017
Research Team Tel: 022 - 39357800
DISCLAIMER
Angel Broking Private Limited (hereinafter referred to as “Angel”) is a registered Member of National Stock Exchange of India
Limited,Bombay Stock Exchange Limited and Metropolitan Stock Exchange Limited. It is also registered as a Depository Participant with
CDSL and Portfolio Manager with SEBI. It also has registration with AMFI as a Mutual Fund Distributor. Angel Broking Private Limited is a
registered entity with SEBI for Research Analyst in terms of SEBI (Research Analyst) Regulations, 2014 vide registration number
INH000000164. Angel or its associates has not been debarred/ suspended by SEBI or any other regulatory authority for accessing
/dealing in securities Market. Angel or its associates/analyst has not received any compensation / managed or
co-managed public offering of securities of the company covered by Analyst during the past twelve months.
This document is solely for the personal information of the recipient, and must not be singularly used as the basis of any investment
decision. Nothing in this document should be construed as investment or financial advice. Each recipient of this document should make
such investigations as they deem necessary to arrive at an independent evaluation of an investment in the securities of the companies
referred to in this document (including the merits and risks involved), and should consult their own advisors to determine the merits and
risks of such an investment.
Reports based on technical and derivative analysis center on studying charts of a stock's price movement, outstanding positions and
trading volume, as opposed to focusing on a company's fundamentals and, as such, may not match with a report on a company's
fundamentals. Investors are advised to refer the Fundamental and Technical Research Reports available on our website to evaluate the
contrary view, if any.
The information in this document has been printed on the basis of publicly available information, internal data and other reliable
sources believed to be true, but we do not represent that it is accurate or complete and it should not be relied on as such, as this
document is for general guidance only. Angel Broking Pvt. Limited or any of its affiliates/ group companies shall not be in any way
responsible for any loss or damage that may arise to any person from any inadvertent error in the information contained in this report.
Angel Broking Pvt. Limited has not independently verified all the information contained within this document. Accordingly, we cannot
testify, nor make any representation or warranty, express or implied, to the accuracy, contents or data contained within this document.
While Angel Broking Pvt. Limited endeavors to update on a reasonable basis the information discussed in this material, there may be
regulatory, compliance, or other reasons that prevent us from doing so.
This document is being supplied to you solely for your information, and its contents, information or data may not be reproduced,
redistributed or passed on, directly or indirectly.
Neither Angel Broking Pvt. Limited, nor its directors, employees or affiliates shall be liable for any loss or damage that may arise from
or in connection with the use of this information.